PHPlot, MySQL and the Dark Ages of Camelot
 The Dark Ages of Camelot (DAoC) is one of a number of Massive Multiplayer Online Role playing games (MMORPG) available for people who like those types of things. Mythic Entertainment, the company behind DAoC decided to offer an xml feed with various statistics about the game including the number of active players. From April 2002 to July 2005 I used a cron job to query the xml feed once every 5 minutes, parse the results and store the statistics in a database table.
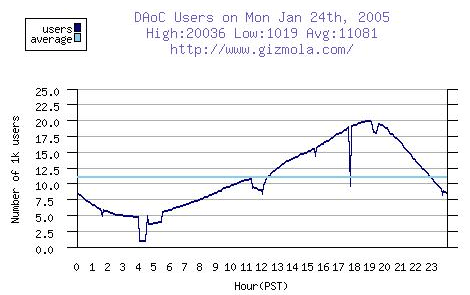
I made a graph of these statistics available on a fan site I operated. The graph used the open source PHPlot graphing class in order to draw a line graph charting the number of players playing the game by hour for a 24 hour period. Visitors to the site would see the line graph shown here, plotting the number of players per hour against a second line showing the day's average. Like many PHP graphing libraries, PHPlot assumes that you have the GD library installed and available to PHP on order for the graphs to work.
This was one of my early experiments with PHP, and illustrated its power and flexibility. Now that the site where the graph appeared is no longer online, I figured I would provide the code, and a small subset of the database, for people interested in how to program with PHPlot. At the time I created this code, PHPlot didn't have much documentation and required some trial and error experimentation. Of course, since then (several years now) PHPlot has been improved, and should definately be considered if you want graphing in your application. Because I don't want to spend time debugging old obsolete code, I've provided the library I used in the download along with the graph script. It would probably work with the latest release, but I don't have time to test it. You can download my example database, version of PHPlot and script here. The database contains one months data, so you can play with the script and explore the class.
Read on for some brief instructions and an explanation of the code. Continue reading "PHPlot, MySQL and the Dark Ages of Camelot"

